News
TOP-3 Custom Reports in GA4
...Every Marketing Specialist Needs in Daily Workflow

As the digital marketing world continues to transform, the shift from Google Universal Analytics (GAUA) to Google Analytics 4 (GA4) in July 2023 has been a significant turning point for the entire digital marketing community.
With GAUA no longer processing data, the reliance on GA4's advanced reporting capabilities has become essential. This change is particularly crucial for all marketing professionals, who depend on comprehensive analytics to evaluate the effectiveness of their strategies in meeting business KPIs.
Adapting to the GA4 interface, which is significantly different from its predecessor, the new event-driven data model and the lack of familiar built-in reports presented an initial challenge. To aid in understanding these new changes, presented below are the key custom reports in GA4 that have become an important part of a marketing professional's daily workflow.
As an example, we will take the e-commerce site with GA4 property 'Google Merch Shop'. On this website several “Recommended events” have been added manually which will be used in the following reports (e.g. 'view_item', 'add_to_cart', 'purchase'). “Recommended events” predefine individual actions on your website, for further details on this I refer to the following webinar by fischerAppelt, performance.
1. Funnel Exploration Report
Purpose
This report tracks a user's journey through the marketing funnel, helping to determine where users are dropping out and where the funnel needs to be optimised in order to increase conversion rates.
Suppose we want to track how users go from the homepage to product pages, add items to their cart and go to the checkout page, broken down by channel.
How to Set Up
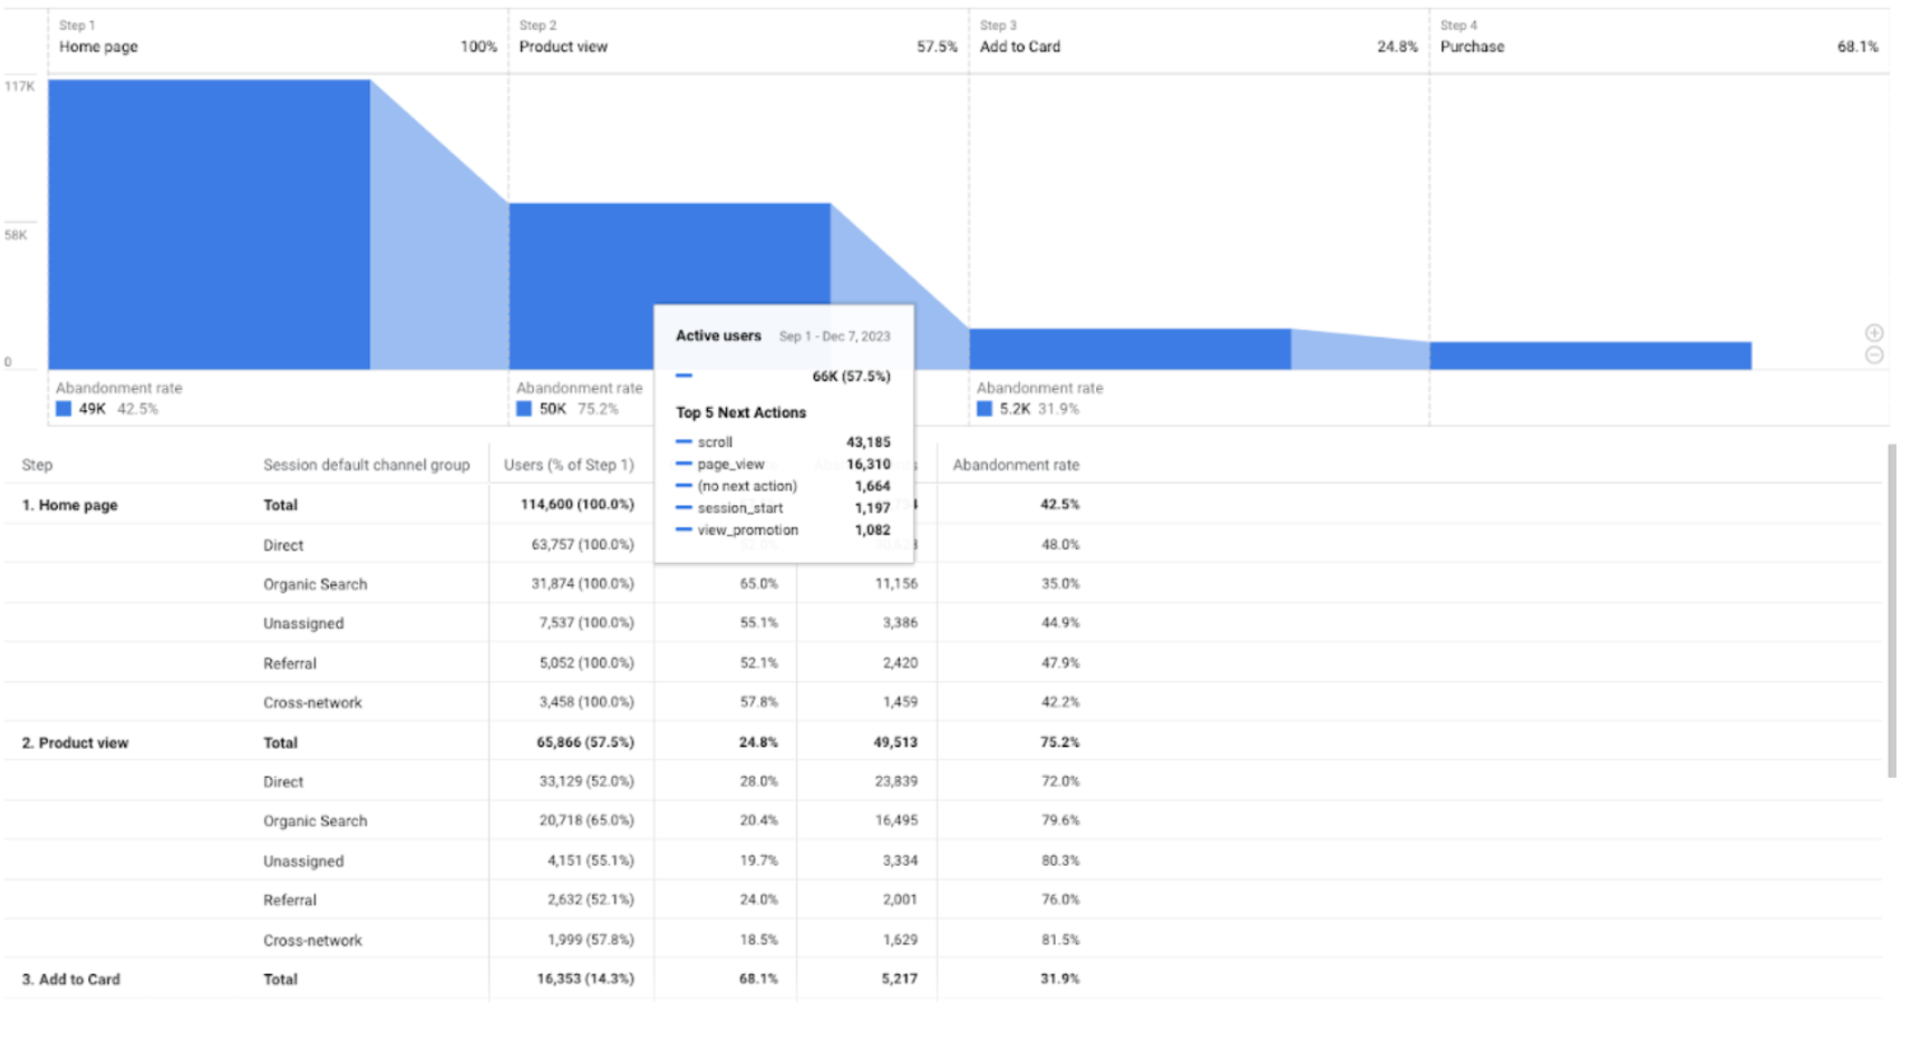
In the GA4 'Exploration' section, create a 'Funnel Exploration' report and start building it as follows:
- In the Steps section, define the conditions that make up the funnel stages:
- 'Step 1' name as 'Homepage view' and set event name 'page_view' for it with page title 'Home';
- 'Step 2' as 'Product view' with event name 'view_item';
- 'Step 3' as 'Add to cart' with event name 'add_to_cart';
- 'Step 4' as 'Purchase' with event name 'purchase'.
- In the breakdown section add 'Session default channel group'.
Additional features
The funnel can also be broken down by a variety of other dimensions, such as 'Device Category', 'City', etc. For example, the breakdown by "City" allows you to identify geographical patterns in user behaviour, which helps you develop region-specific marketing strategies.
Another beneficial feature is the ability to observe the most common user actions after each step in the funnel as the next event or page visited (see example on the screenshot 1).
Why it is useful
This report provides a comprehensive overview of abandonment rates at each stage of the user journey. By identifying where the most significant drops are, you can identify critical areas for optimization. In addition, the ability to segment users by various parameters allows for more in-depth user insights.
2. Page Path Analysis Report
Purpose
This custom report can be used to track the sequence of pages or events leading up to a key action (like a purchase event in our case). It can help to understand what paths users take and what they do before and after an important conversion.
In our case, we will create a report that shows which pages users visited before they made a purchase.
How to Set Up
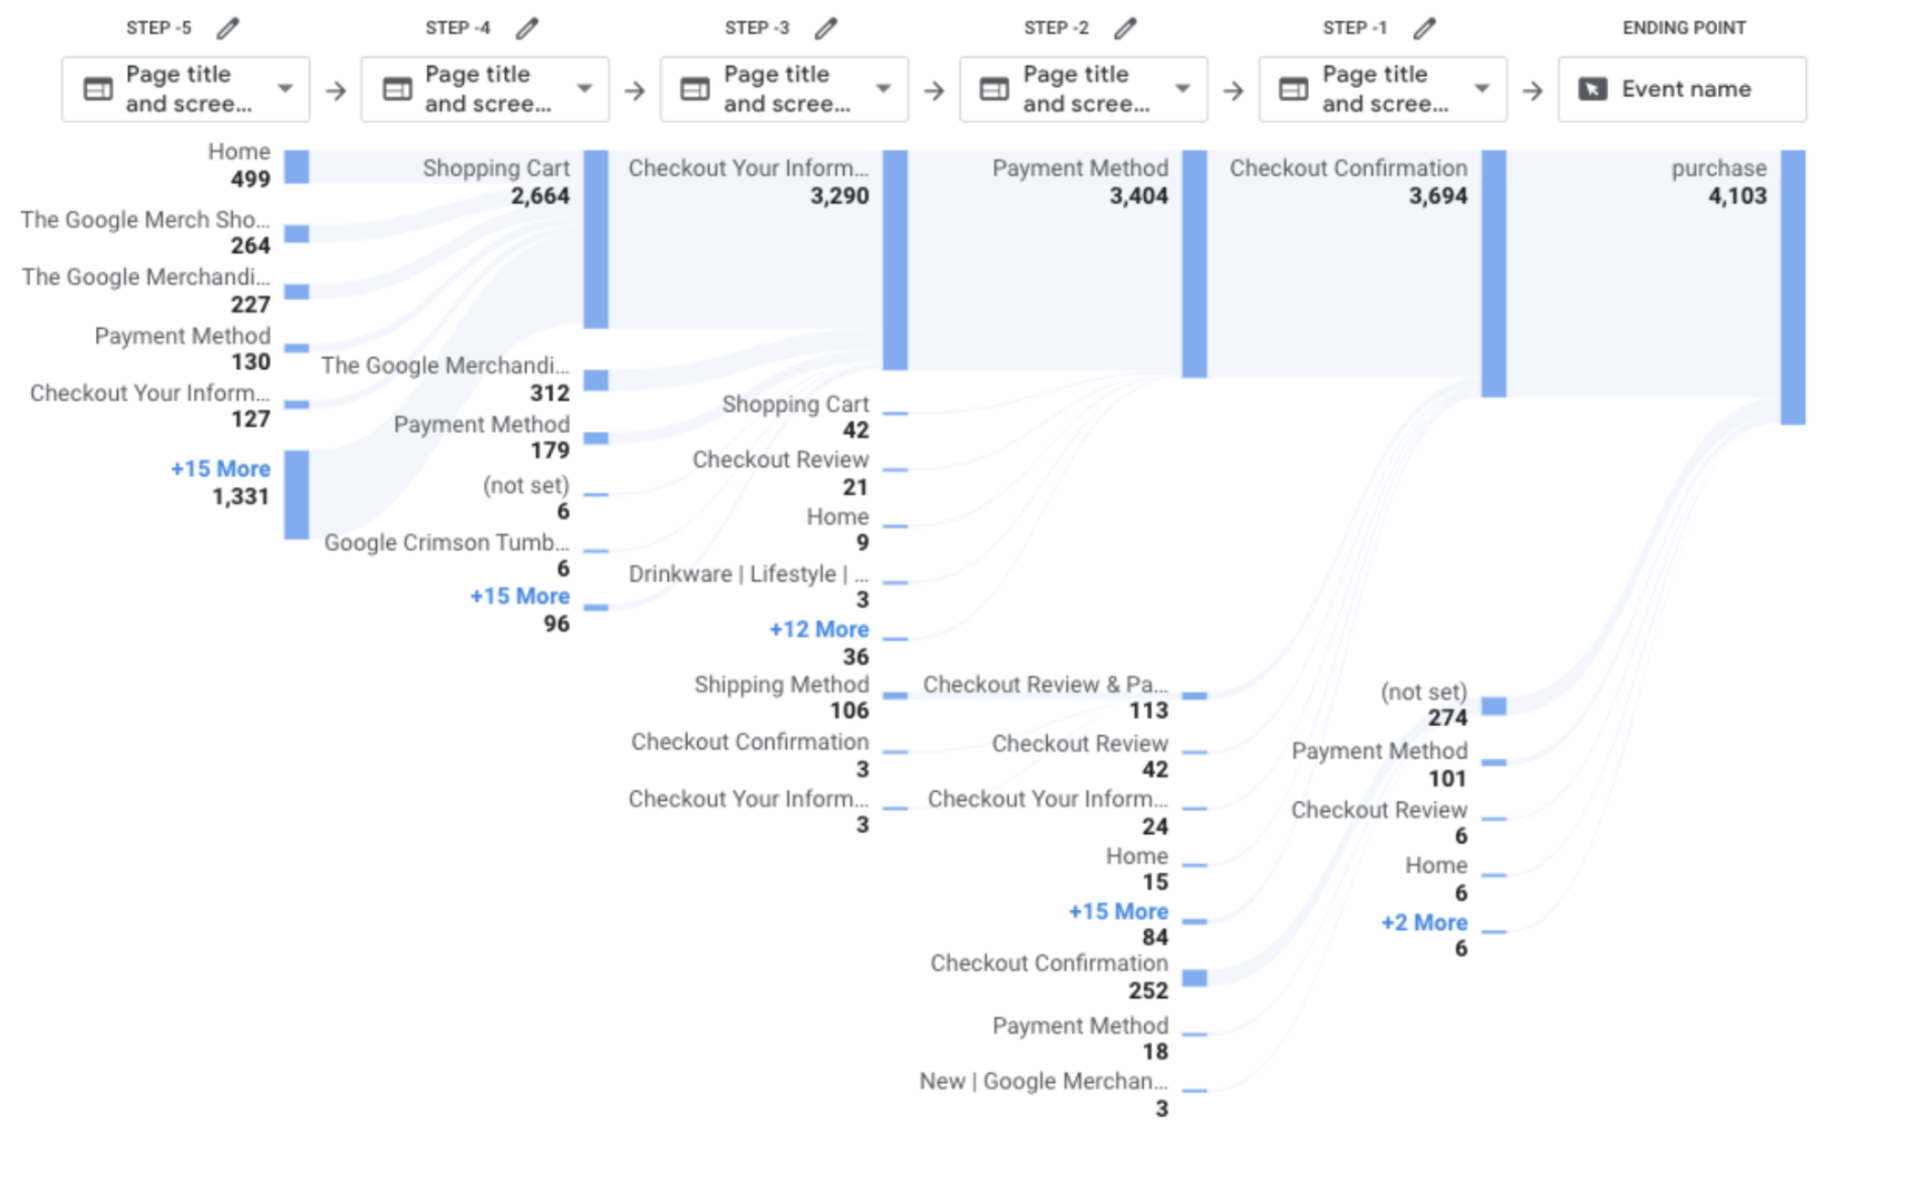
In GA4 'Exploration' section choose the 'Path Exploration' report and start customising the report from scratch:
- Set the purchase event as the ending point.
- Select 'Page Title and screen name' as the dimension for 'Step -1' to visualise the last page users visited before the conversion.
- Interact with visual nodes along the path. Clicking on a node will show you the sequence of pages visited.
Additional features
The Path exploration tool allows you to define the start and end point of a user's journey. This can be either an event point or a visited page. By analysing post-purchase behaviour, for example, a report can provide insights into potential upsell opportunities or general post-conversion actions that can be used in marketing and content strategies.
Using breakdown parameters such as 'City' or 'Device Category' to segment paths by user demographics or device usage is also available in this report.
Why it is Useful
The Path Exploration report is useful because it can show a user's path from landing on the website to conversion. By understanding the paths users typically take, you can optimise content and site structure to increase conversions.
3. Conversion Rate over time
Purpose
This report helps in tracking the effectiveness of marketing channels in leading to conversions over a specified period. It is crucial for understanding the direct impact of various marketing strategies on achieving business goals.
How to set up
In the GA4 'Exploration' section, create a new free-form report and follow the steps below:
- Select 'Line chart' visualisation.
- Add 'Session Conversion Rate' to the 'Values'.
- In the breakdown section add 'Session default channel group'.
- To track a specific conversion event or group of events, apply a second filter using regex format to capture these relevant events. You can add up to 256 characters in total to regular expressions by separating individual events with '|': Event name matches regex: session_start|event_name_1|event_name_2|etc…
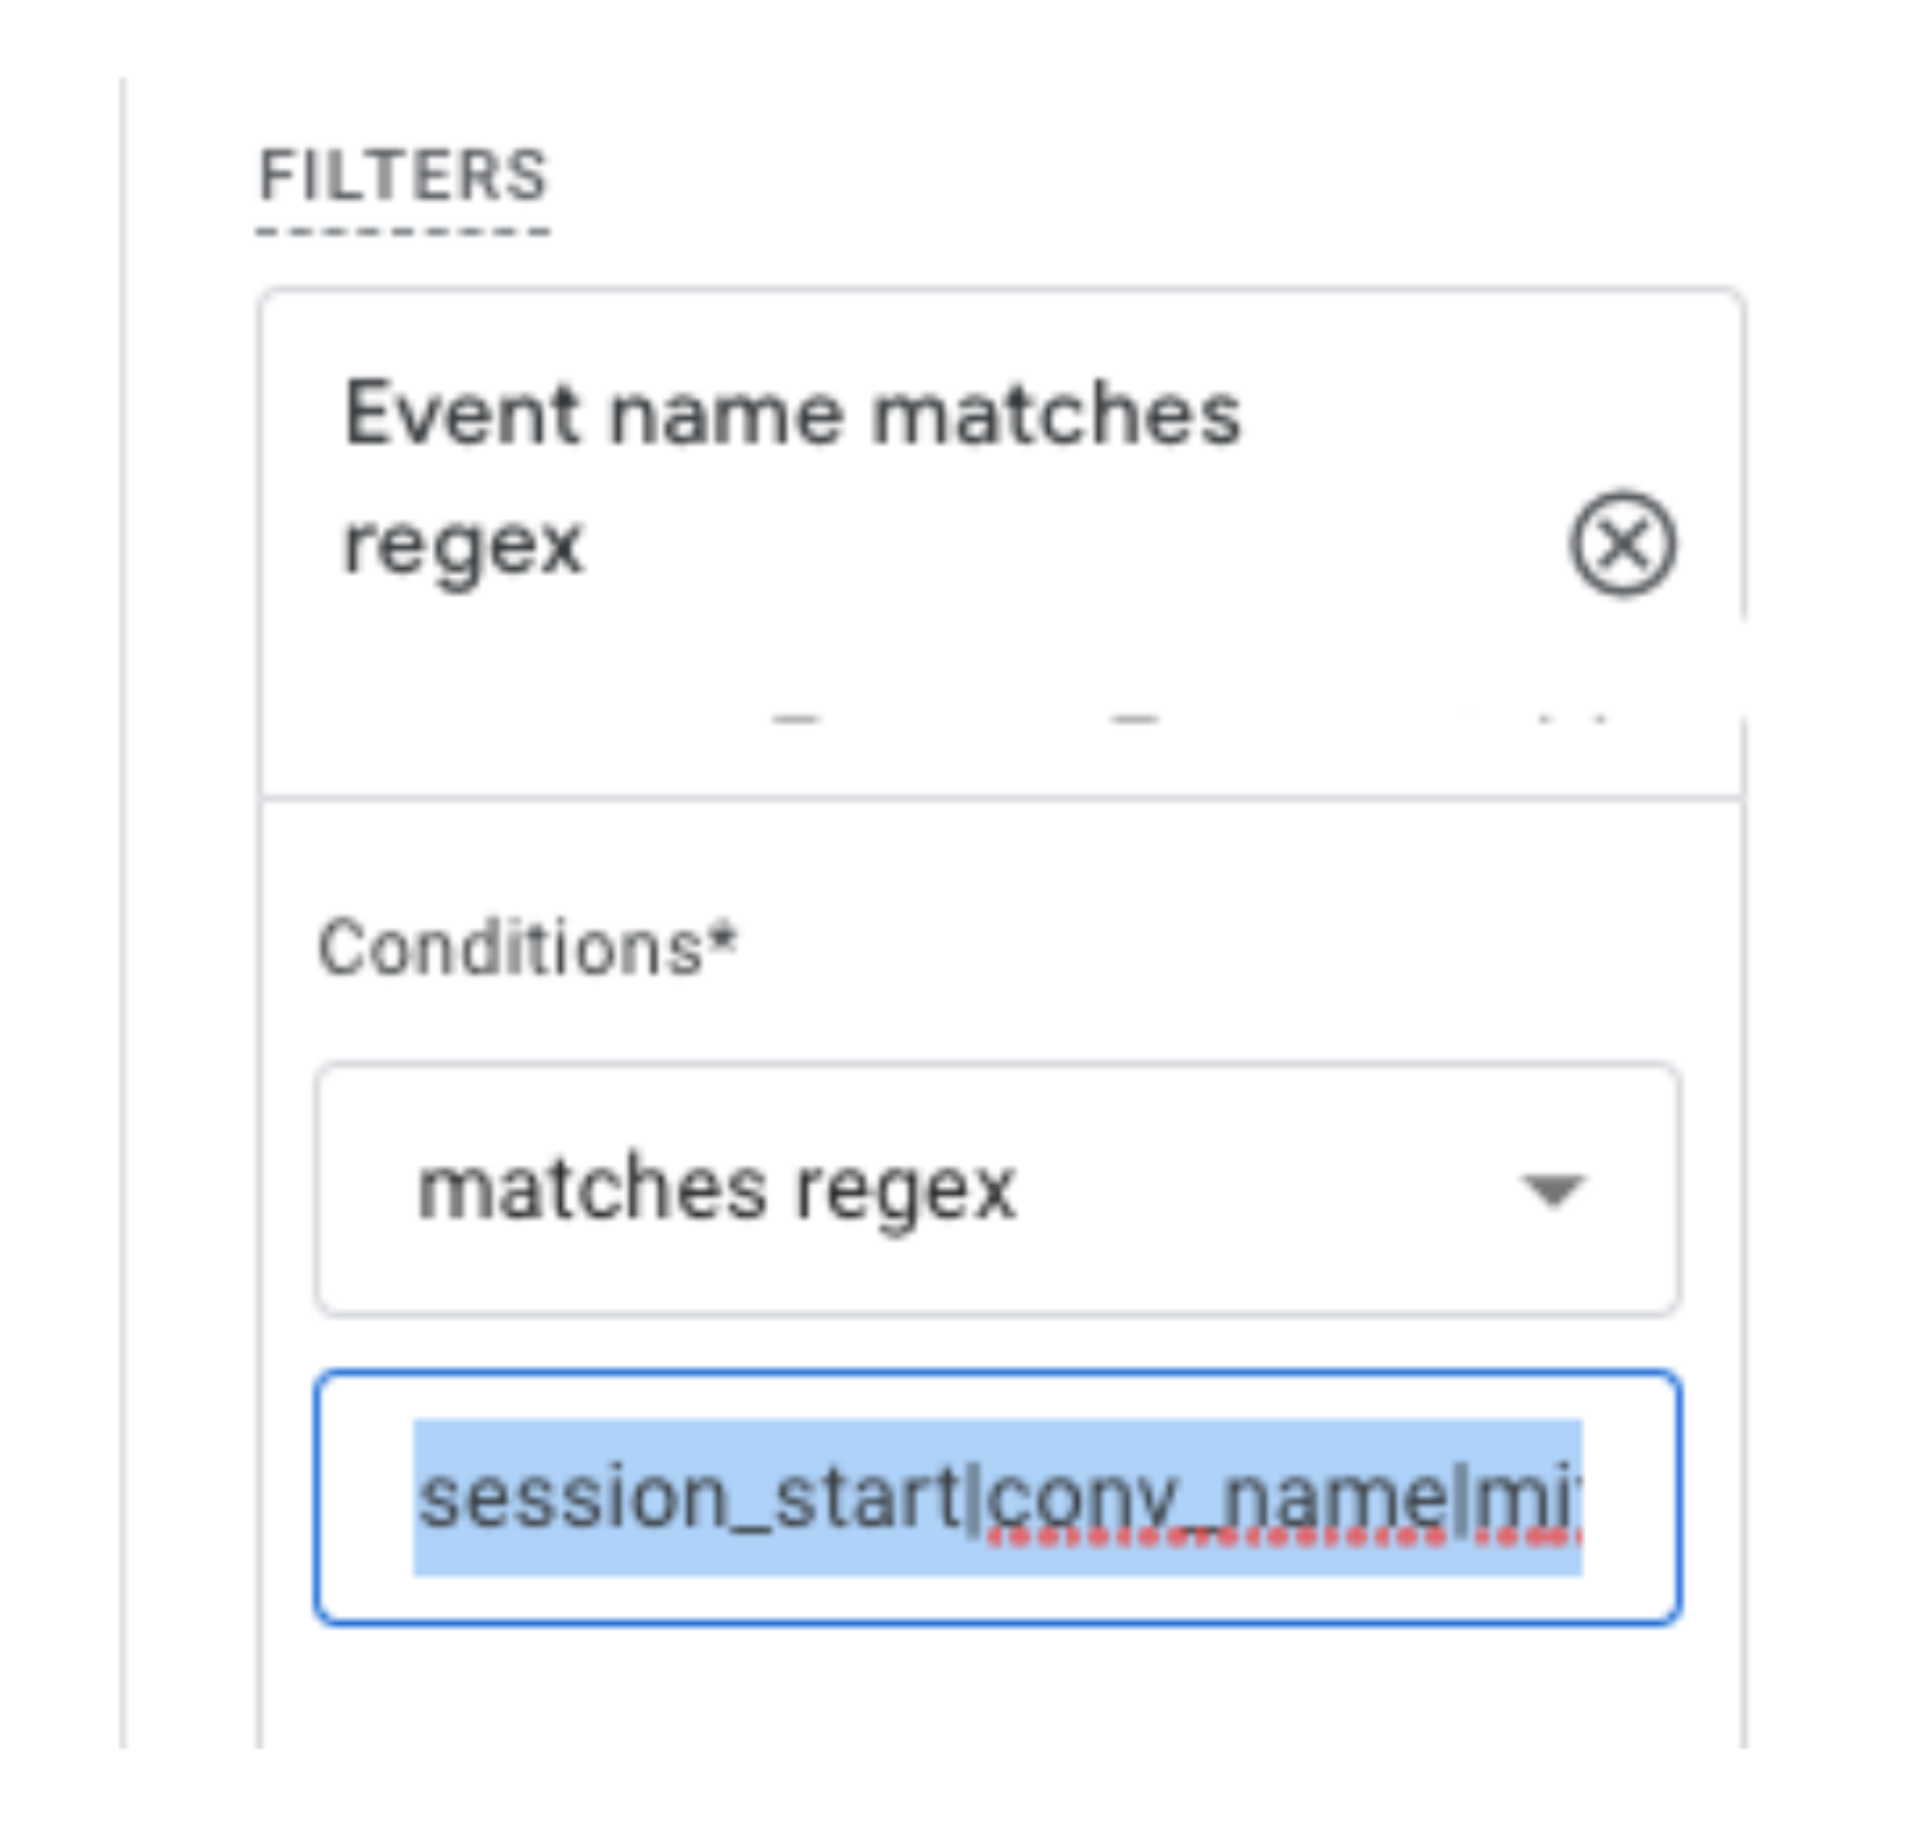
Enabling the 'session_start' event is required when applying filters to specific events in a report. It marks the beginning of a user's session with the site. If this event is not included, the report will show inflated conversion rates, like in the example in the 'Screenshot 4' below:
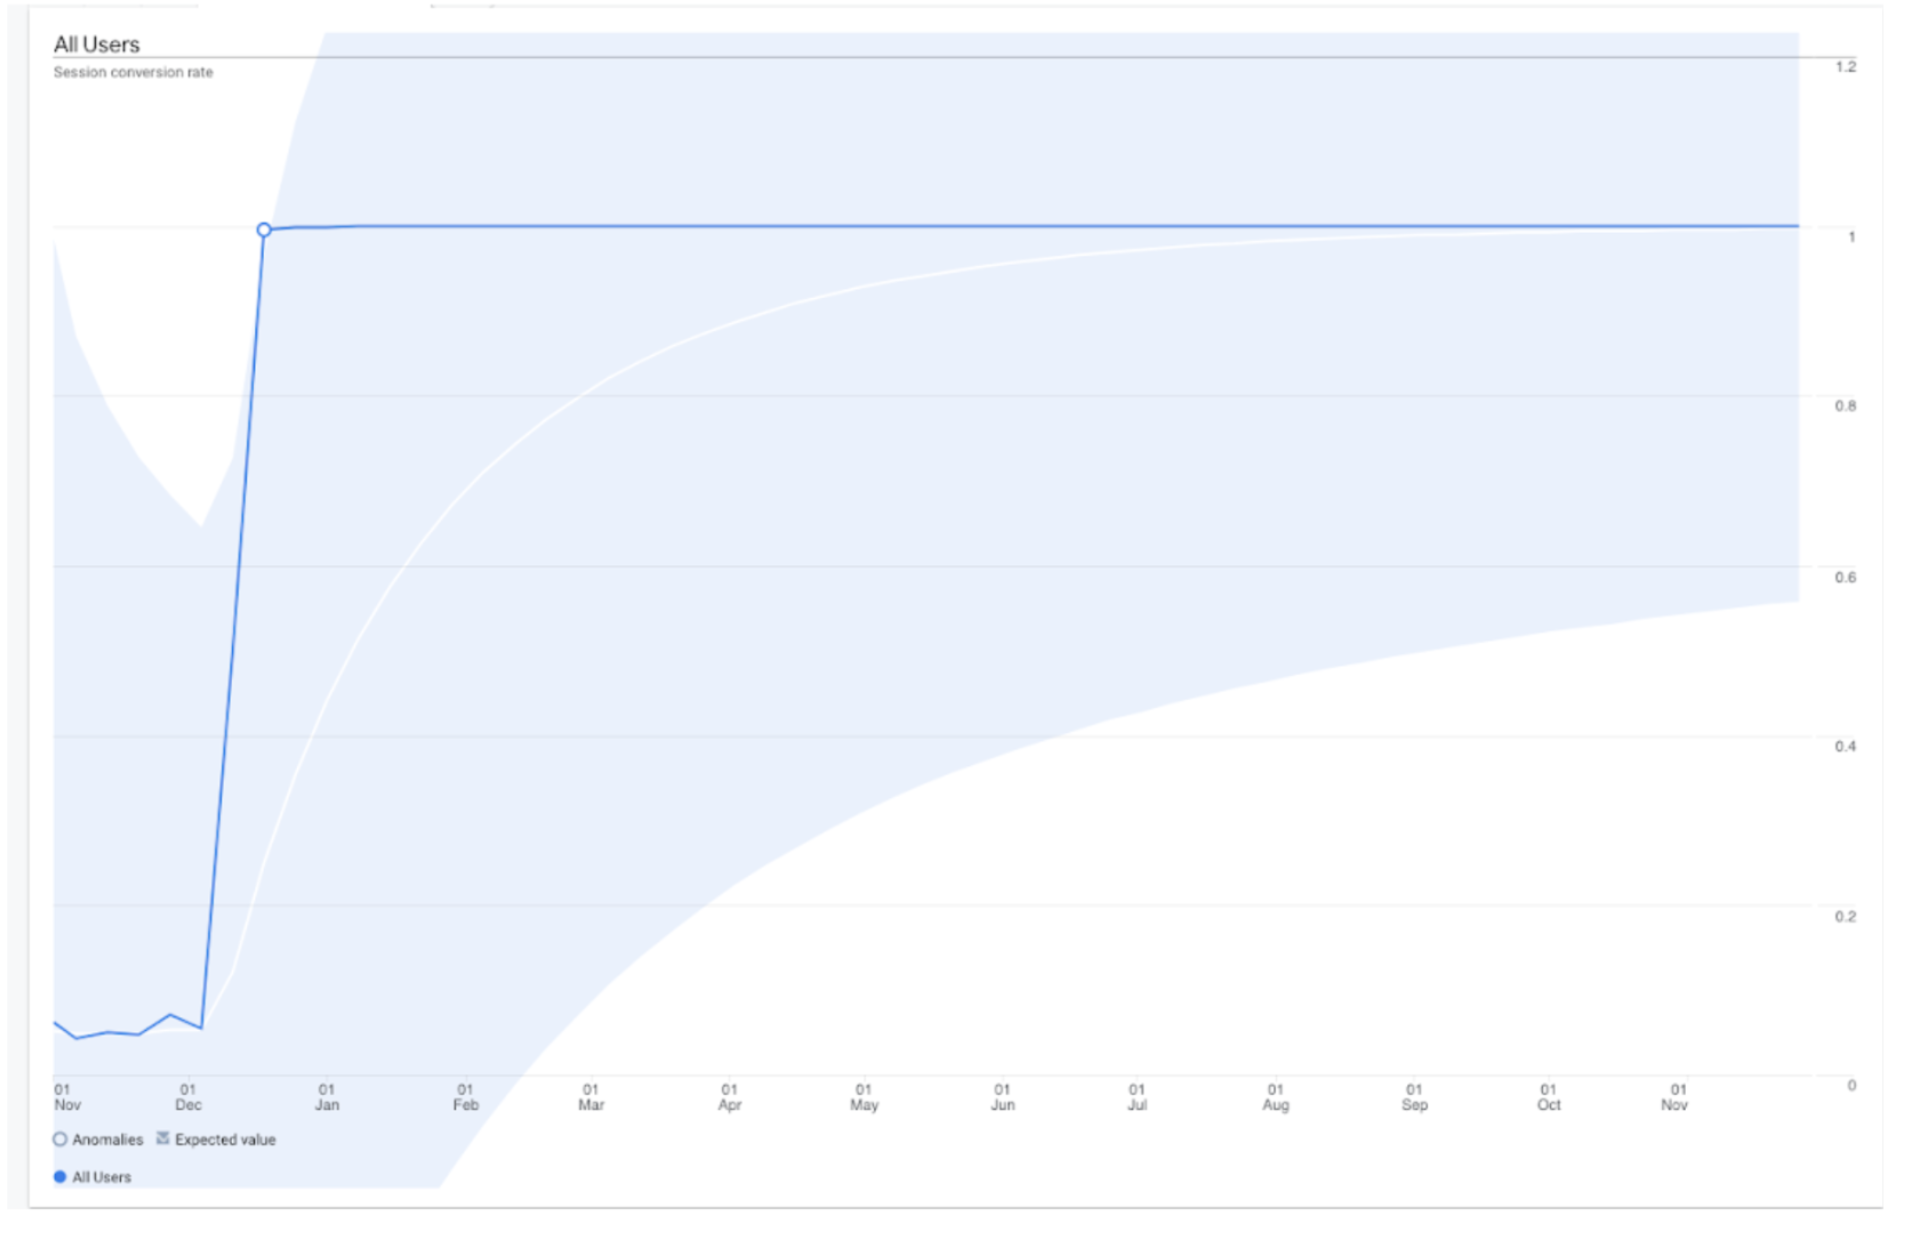
This happens because the conversion rate is calculated based on a reduced number of sessions - only those that contain the events specified in the filter. By including 'session_start', you ensure that all user sessions are counted, allowing you to accurately calculate your conversion rate.
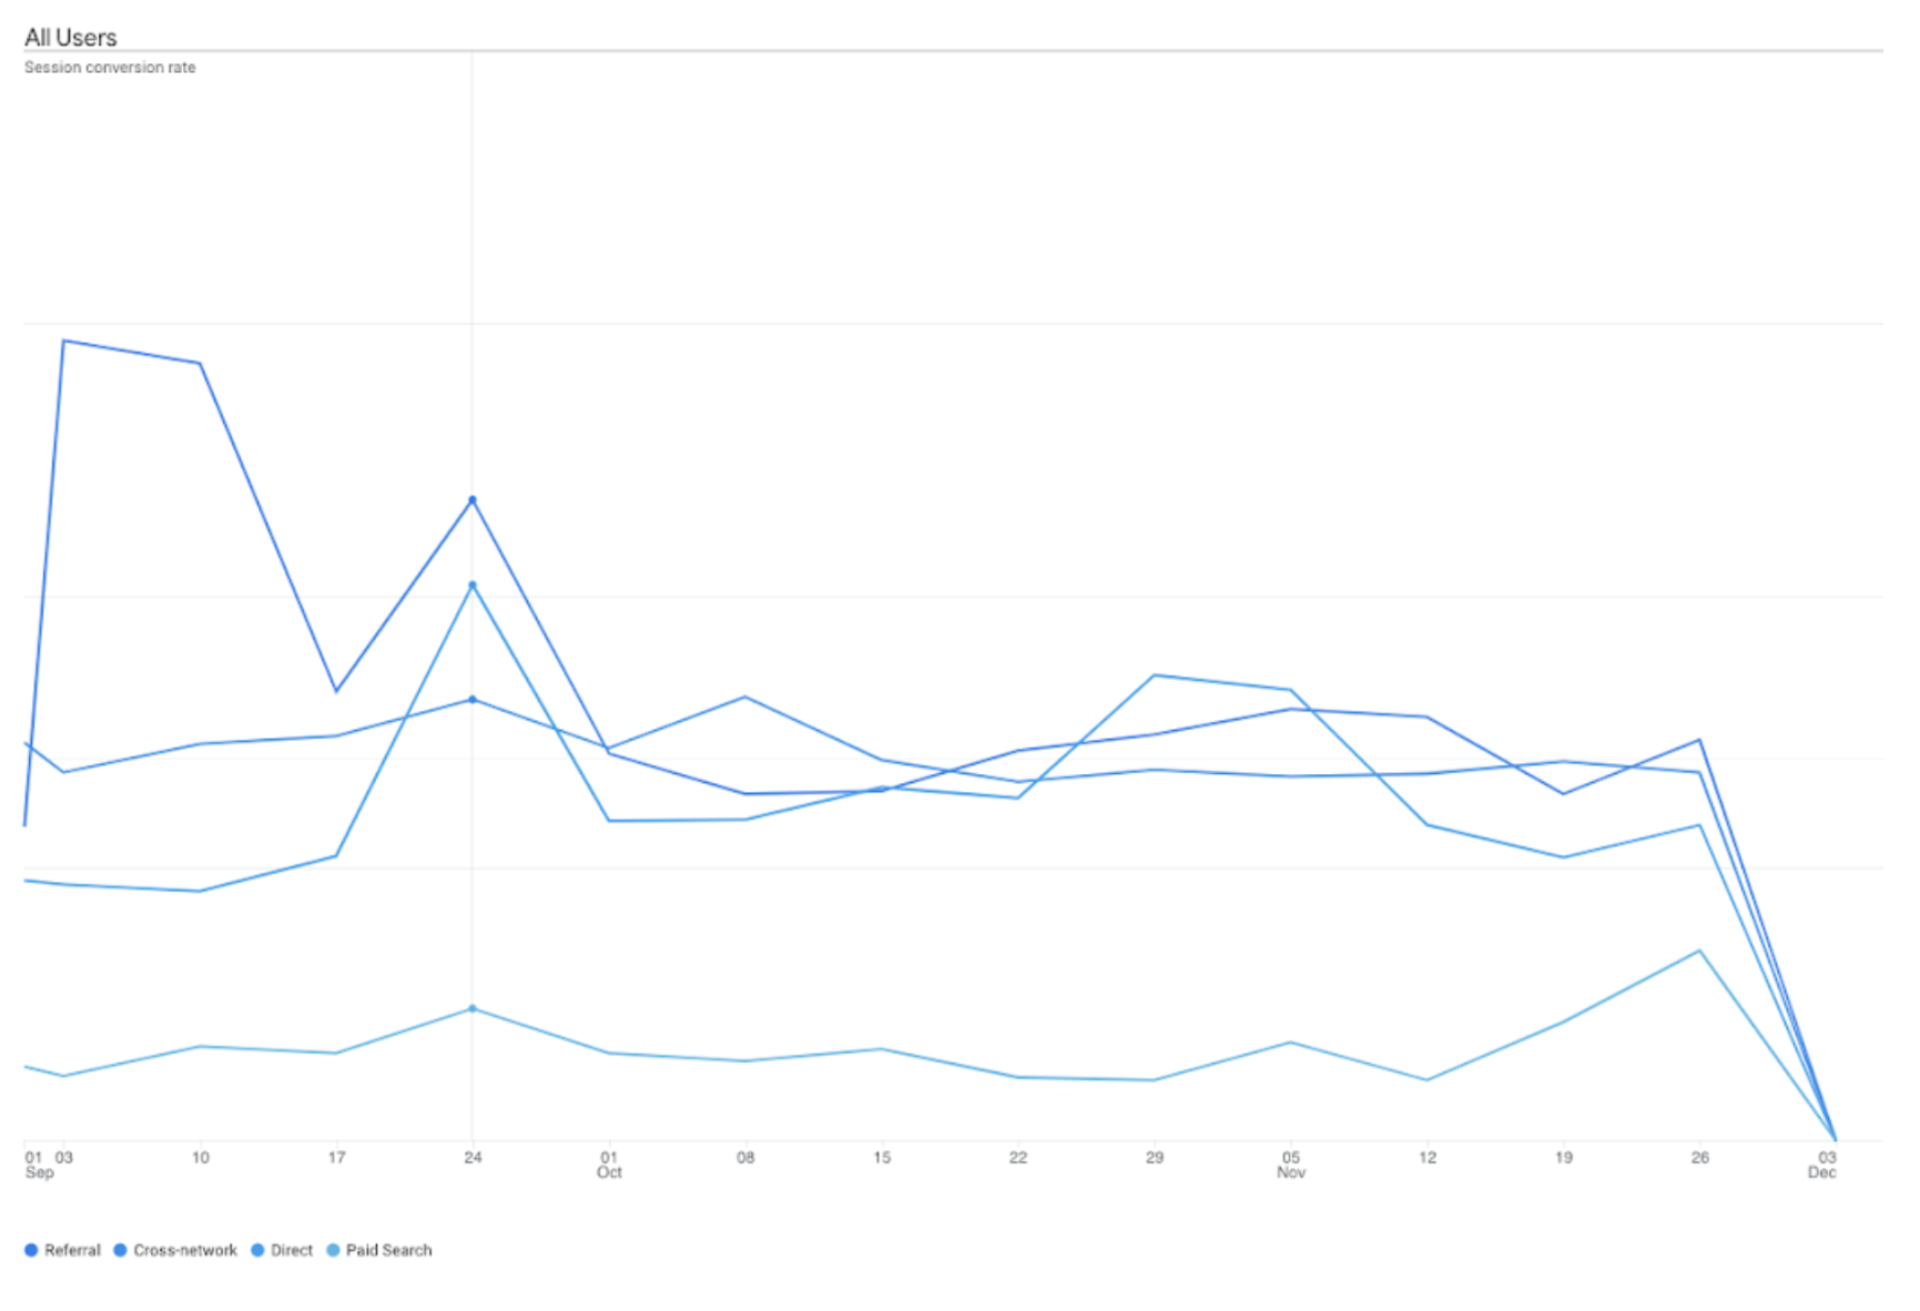
Why it is Useful
This report is vital to evaluate the real impact of different advertising channels. By observing how conversion rates fluctuate over time, you can correlate these changes with specific marketing activities or content updates.
Conclusion
GA4 is more than just a tool for tracking metrics, it is key to understanding user behaviour, preferences, and interactions with your website. Using these reports effectively allows marketing professionals to understand their audience more precisely, improve their strategies, and achieve better results in user engagement.